[tatsu_section bg_color= "" bg_image= "" bg_repeat= "no-repeat" bg_attachment= "scroll" bg_position= "top left" bg_size= "cover" bg_animation= "none" padding= "90px 0px 90px 0px" margin= "0px 0px 0px 0px" border= "0px 0px 0px 0px" border_color= "" bg_video= "0" bg_video_mp4_src= "" bg_video_ogg_src= "" bg_video_webm_src= "" bg_overlay= "0" overlay_color= "" full_screen= "0" section_id= "" section_class= "" section_title= "" offset_section= "" offset_value= "0px" full_screen_header_scheme= "background--dark" hide_in= "0"][tatsu_row full_width= "0" no_margin_bottom= "0" equal_height_columns= "0" gutter= "medium" column_spacing= "px" fullscreen_cols= "0" swap_cols= "0" row_id= "" row_class= "" hide_in= "0" layout= "1/1"][tatsu_column bg_color= "" bg_image= "" bg_repeat= "no-repeat" bg_attachment= "scroll" bg_position= "top left" bg_size= "cover" padding= "0px 0px 0px 0px" custom_margin= "0" margin= "0px 0px 0px 0px" border= "0px 0px 0px 0px" border_color= "" bg_video= "0" bg_video_mp4_src= "" bg_video_ogg_src= "" bg_video_webm_src= "" bg_overlay= "0" overlay_color= "" animate_overlay= "none" link_overlay= "" vertical_align= "none" column_offset= "0" offset= "0px 0px" z_index= "0" column_parallax= "0" animate= "0" animation_type= "fadeIn" animation_delay= "0" col_id= "" column_class= "" hide_in= "0" layout= "1/1"][tatsu_text max_width= "100" wrap_alignment= "center" animate= "" animation_type= "fadeIn" animation_delay= "0"]
As the next generation of computer interface emerges, it is important for our clients to adapt the technology. In response to this VirtuLabs has researched and developed methods of interaction for financial software in augmented and virtual reality.
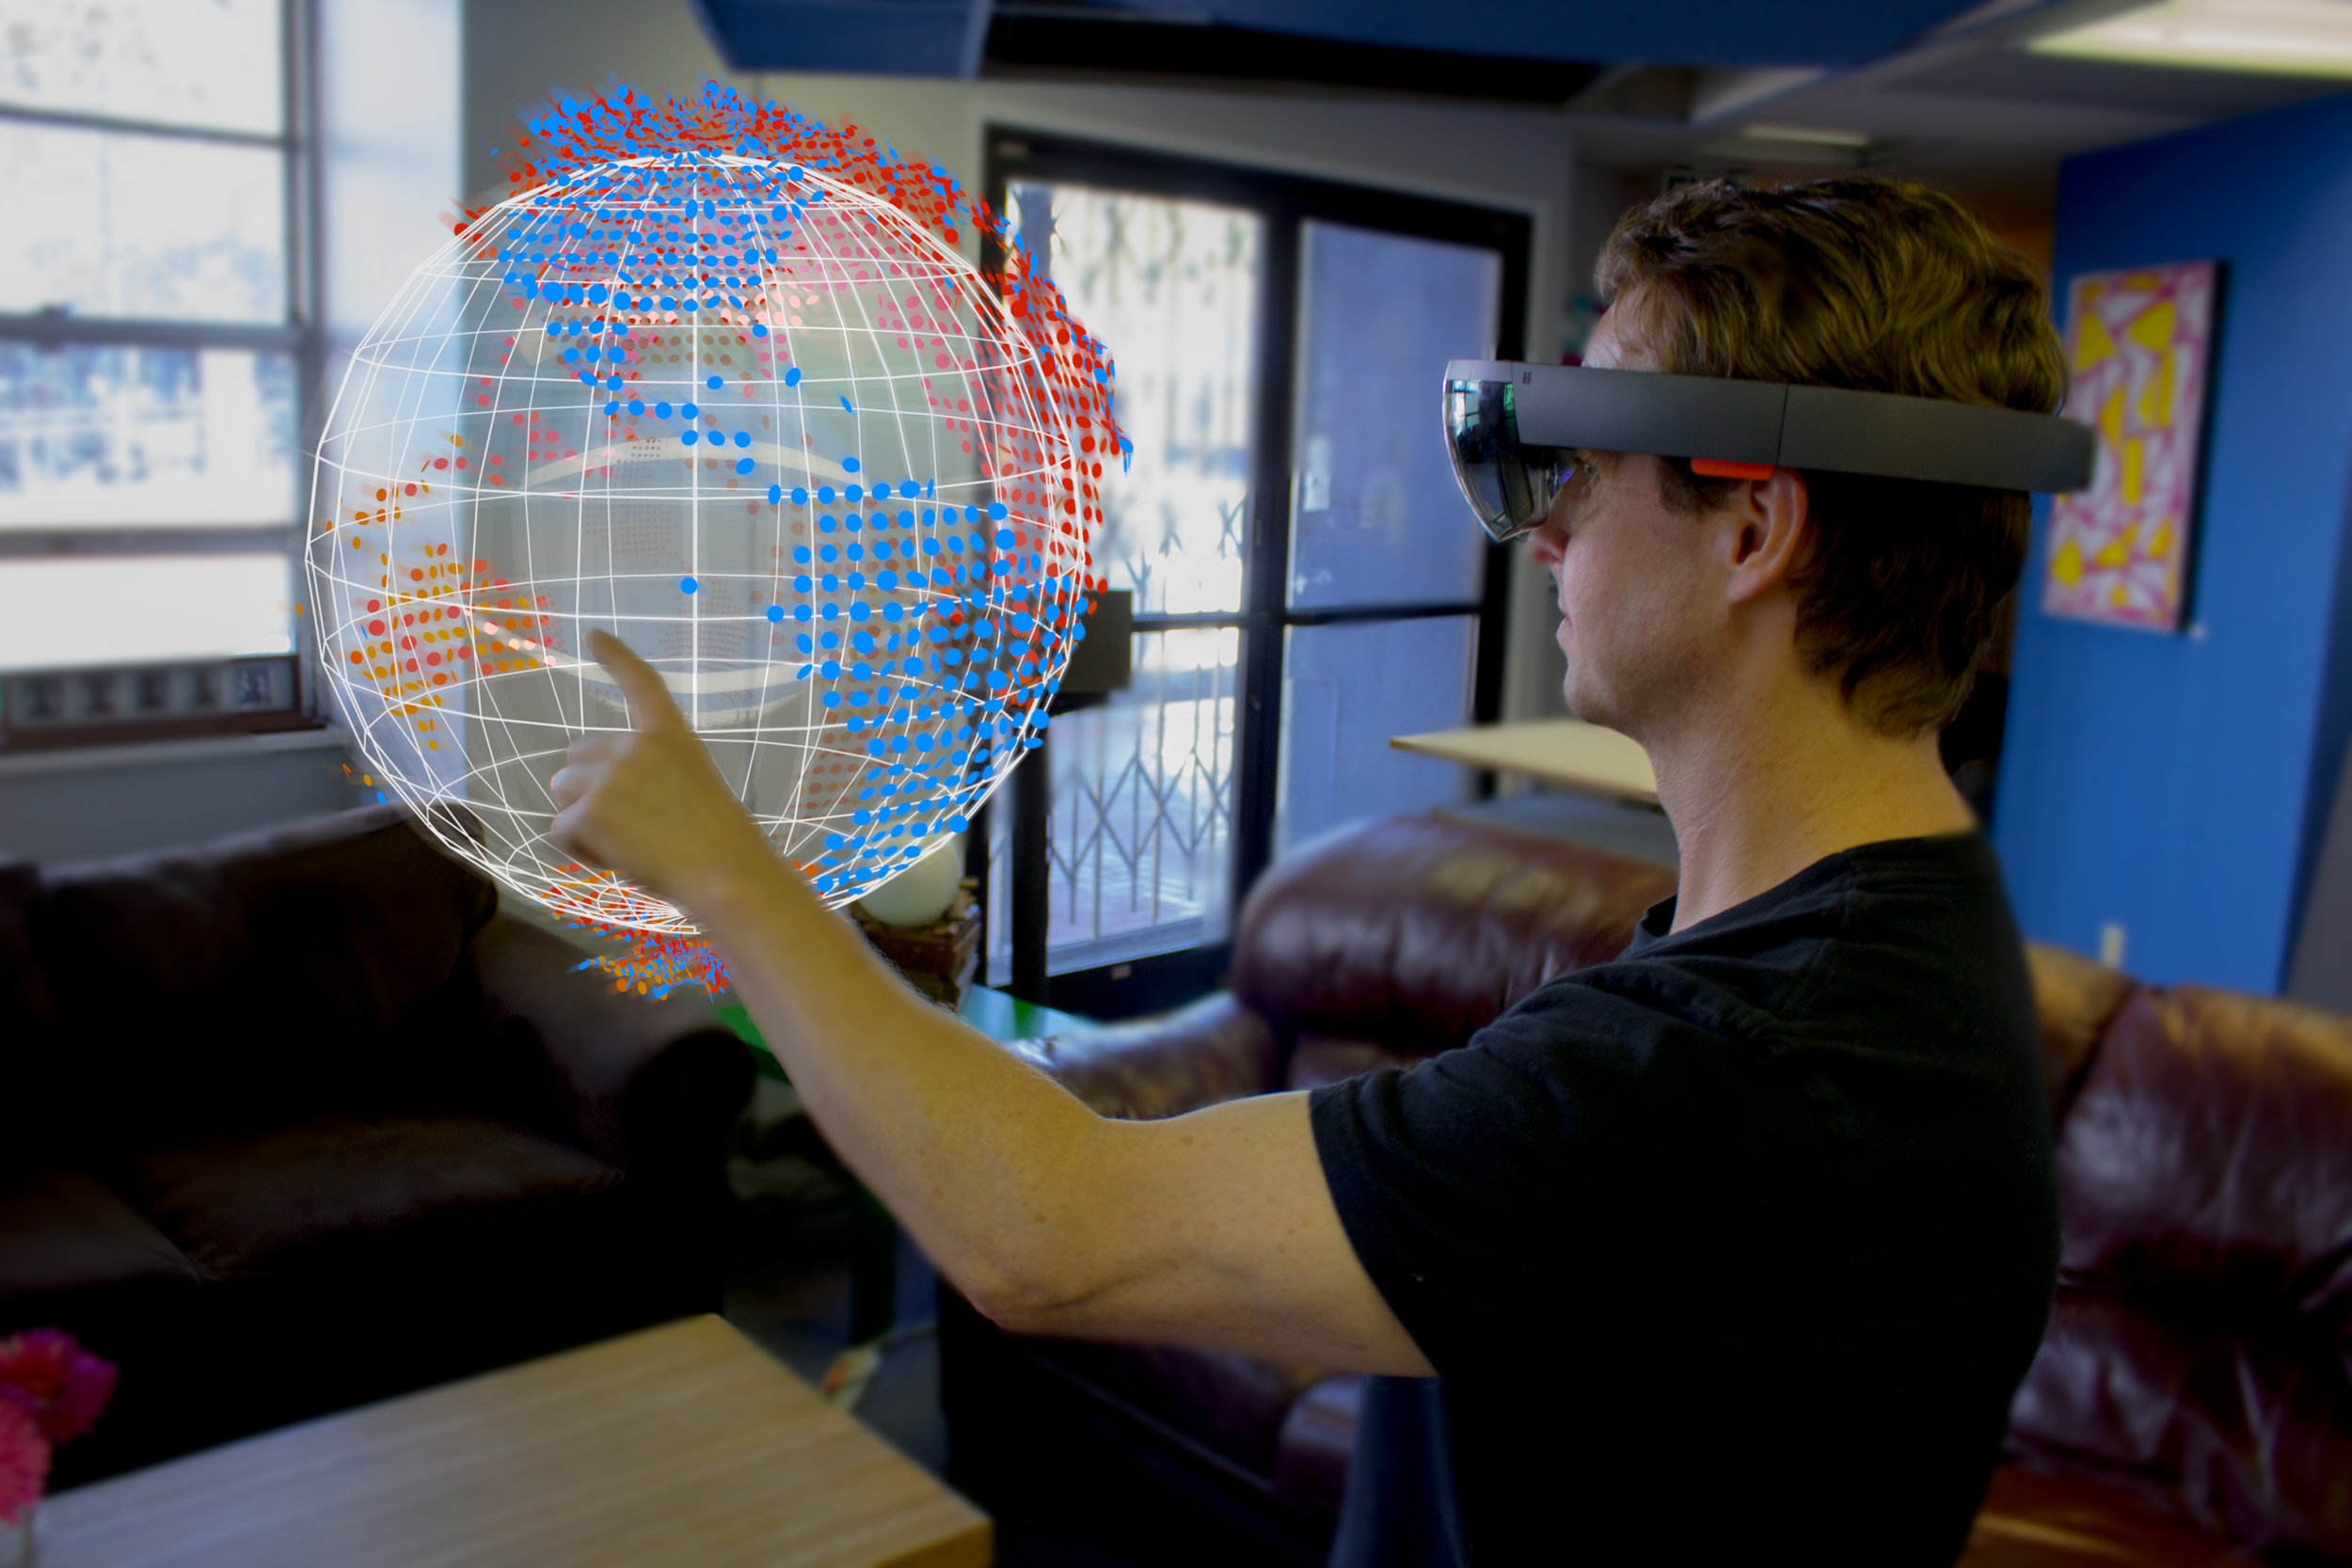
We explored the language of communicating data in 3D to understand ways to take advantage of all dimensions in augmented reality and virtual reality to deliver information based on the user’s perspective, interest, and urgency.
Creating a mechanism to become aware of the user’s intention by analyzing the gaze through reactive design, we achieved developing a complex system for demonstrating massive amount of data and organizing it in a spatial system. The user could walk through and explore the data, click, move and interact with different data visualizations. Moving through space was used to provide different levels of detail for specific data through Z axis.
[/tatsu_text][/tatsu_column][/tatsu_row][/tatsu_section]
No comments.